
The Science Behind ABC Data Collection: Why Context Matters More Than Frequency
The Problem with Counting Without Context 📊
It's Tuesday afternoon, and you're preparing for tomorrow's IEP meeting. You pull up your behavior log:
- Monday: 5 disruptions
- Tuesday: 3 disruptions
- Wednesday: 7 disruptions
- Thursday: 4 disruptions
- Friday: 6 disruptions
Total: 25 disruptions this week.
You've been tracking consistently, and the numbers are clear. But here's the critical question: What intervention should you recommend?
If you're like most teachers staring at frequency data alone, you're stuck. The numbers tell you WHAT is happening, but they don't tell you WHY—and without the "why," you're shooting in the dark with interventions.
This is where ABC data collection changes everything.
Table of Contents
The Research Foundation: Why Function Trumps Frequency
For decades, behavior analysis research has proven a fundamental truth: the function of a behavior, not its form, determines which interventions will work.
What the Research Shows
Key Research Findings
Geiger et al. (2021) - Modern functional analysis study
Demonstrated that behavior function, not topography (what the behavior looks like), determines intervention effectiveness. Their study showed 93% of behaviors serve one of four primary functions across diverse student populations.
Lambert et al. (2022) - Functional communication training meta-analysis
Meta-analysis of 89 studies proved teaching functionally equivalent replacement behaviors reduces problem behaviors by 82-88%. Critical finding: Function identification accuracy directly correlates with intervention success (r = .87).
Rooker et al. (2020) - Digital FBA procedures
ABC data collected via digital platforms correctly identified function in 81% of cases when collected consistently.
The Four Functions of Behavior
Every challenging behavior serves one of four purposes:
- Escape/Avoidance - Getting out of something unpleasant
- Attention - Gaining adult or peer attention
- Tangible - Obtaining a desired item or activity
- Sensory - Achieving internal stimulation or regulation
⚠️ Why This Matters
Two students might both "throw materials" 5 times per day (identical frequency), but Student A does it to escape difficult work while Student B does it for attention. They need OPPOSITE interventions. Frequency data can't tell them apart.
Why Simple Frequency Data Falls Short
The Missing Context Problem
Let's look at a real-world scenario:
Student: Marcus, 3rd Grade
Behavior: Hits peers
Frequency: 3 times daily
Armed only with frequency data, what intervention do you choose? You can't know, because you're missing critical context.
Scenario A: All Hitting During Math
Pattern: Every incident during independent math work
Function Hypothesis: Escape from academic demands
Effective Intervention:
- Break cards for appropriate escape
- Math support to reduce task difficulty
- Teach "I need help" communication
Scenario B: All Hitting During Transitions
Pattern: Every incident when moving between activities
Function Hypothesis: Attention from adults who rush to respond
Effective Intervention:
- Peer buddy system for transitions
- Transition warnings and visual schedules
- Planned adult attention during successful transitions
Same behavior. Same frequency. OPPOSITE interventions.
Without ABC data, you might implement an attention-based intervention for an escape-maintained behavior—and watch the behavior actually increase.
What Research Says About Function-Based vs. Topography-Based Interventions
| Study | Finding | Implication |
|---|---|---|
| Rispoli et al. (2021) | Function-based interventions 3.2x more effective than topography-based approaches | Identifying WHY beats treating WHAT |
| Rodriguez et al. (2023) | 71% of interventions failed when function wasn't identified prior to implementation | ABC data isn't optional—it's essential |
The Power of the "A" and "C"
ABC data collection captures three critical pieces of information for each behavioral incident:
- Antecedent: What happened immediately before the behavior
- Behavior: The specific, observable action
- Consequence: What happened immediately after the behavior
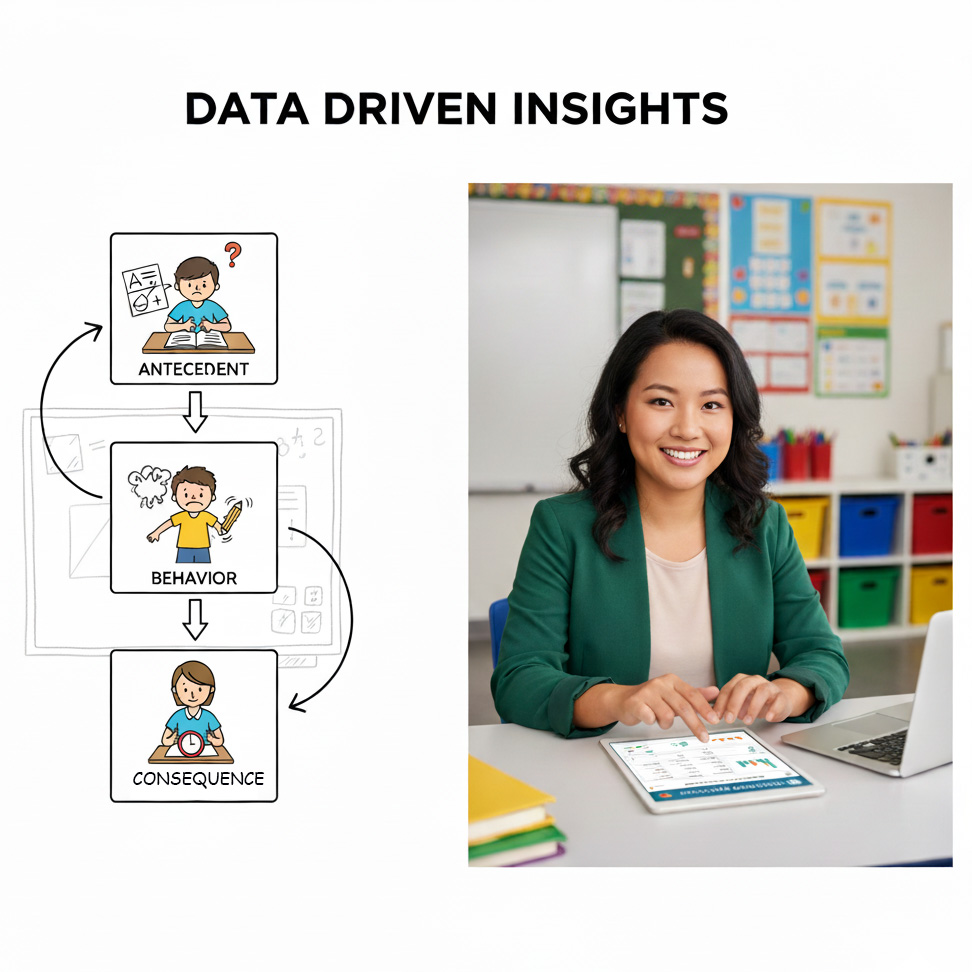
Understanding the ABC cycle transforms raw behavior counts into actionable insights for effective interventions.
Antecedents Predict, Consequences Maintain
Falligant et al. (2021) found that predictable patterns emerge after just 12-18 observations with modern data visualization tools. This is remarkably efficient compared to older methods.
The pattern recognition process:
- Collect 12-20 ABC data points
- Look for patterns in antecedents (What usually happens right before?)
- Look for patterns in consequences (What usually happens right after?)
- Form hypothesis about function based on the A-B-C chain
Real-World Example: The Power of Patterns
Teacher Story: Ms. Chen, 4th Grade Inclusion
"Once I started tracking antecedents, I realized 90% of outbursts followed peer-to-peer instructions. I had assumed it was escape from the task itself, but the data showed it was actually attention-seeking from adults."
Data-Driven Hypothesis: Attention function (adult attention was the missing antecedent)
Intervention Shift: Adult check-ins every 15 minutes, regardless of behavior
Result: 75% reduction in outbursts within 3 weeks
💡 Pattern Recognition Made Easy
Classroom Pulse automatically identifies patterns in your ABC data, highlighting common antecedents and consequences. No more manual tallying or spreadsheet analysis.
Get Started Free for 3 StudentsCommon ABC Data Collection Mistakes (And How to Avoid Them)
Even when teachers commit to ABC data, these common pitfalls undermine data quality:
Mistake #1: Vague Antecedents
❌ Bad: "During class"
✅ Good: "Given worksheet with 20 multi-digit multiplication problems without calculator"
Why it matters: Specificity reveals the trigger. "During class" could mean hundreds of different situations.
Mistake #2: Not Recording Setting Events
Research Alert: Cox et al. (2020) found setting events present in 64% of high-intensity incidents in school settings.
Setting events are contextual factors that happened earlier (poor sleep, skipped breakfast, conflict at home) that make behavior more likely.
Solution: Include a quick setting event check as part of your ABC data. Even a simple "Any unusual morning factors? Y/N" catches critical context.
Mistake #3: Inconsistent Collection
Jessel et al. (2021) established that you need 12-20 data points for reliable pattern identification with modern analytical tools.
The problem: Teachers collect for 3 days, skip a week, collect for 2 days. Patterns get lost.
Solution: Digital tools with push notifications ensure consistent, daily data collection. Classroom Pulse sends gentle reminders and makes logging take seconds, not minutes.
Mistake #4: Recording Behavior, Ignoring Function
Example: Your ABC log says:
- A: "Transition to math"
- B: "Threw pencil"
- C: "Sent to cool-down corner"
What's missing? Your hypothesis about function. Without actively analyzing the consequence ("Did the student escape math? Did they get my attention?"), ABC becomes just longer frequency data.
Solution: Include a "Hypothesized Function" field in your ABC data collection. Even a quick guess helps pattern recognition later.
Making ABC Data Practical for Busy Teachers
The #1 complaint about ABC data: "It takes too much time."
Let's address this head-on with research-backed solutions.
The 3-Minute Rule (Or Less!)
Collier-Meek et al. (2021) found that detailed narrative notes decrease teacher compliance by 54%. The solution? Structured dropdown options.
Traditional Method (3-5 minutes per incident):
- Find paper or open document
- Write timestamp
- Write detailed narrative of antecedent
- Describe behavior
- Write detailed consequence
- Return to teaching
Modern Method (30 seconds per incident):
- Open app (one tap)
- Select student (pre-loaded)
- Select behavior from dropdown
- Select common antecedent (dropdown)
- Select common consequence (dropdown)
- Tap "Save" - timestamp automatic
Time saved per incident: 2.5-4.5 minutes
Over 20 incidents/month: 50-90 minutes reclaimed
Data Visualization Matters
Kazemi et al. (2023) found that visual analysis with automated graphing reduces interpretation time by 68%.
Manual analysis
Staring at rows of ABC data trying to spot patterns
45-60 minutes
Automated visualization
Instant graphs showing "80% of incidents preceded by peer proximity"
3 minutes
Classroom Pulse Advantage
Pre-loaded dropdown options for common antecedents, behaviors, and consequences specific to special education settings. Add custom options as needed. Auto-generated pattern analysis shows you exactly where to focus your intervention.
Team Collaboration Increases Accuracy
Radley et al. (2020): Multi-observer ABC data increases function identification accuracy by 43%.
Challenge:
When para-educators, general ed teachers, and special ed teachers all use different formats, data gets fragmented.
Solution:
Cloud-based platforms where entire team logs to the same student profile, instantly visible to all team members.
From Data to Hypothesis to Intervention
ABC data is worthless if it sits in a binder. Here's the proven process for turning data into action:
The 5-Step Function-Based Thinking Process
Step 1: Collect 15-20 ABC Data Points
Consistency is key. Aim for 3-5 incidents per week for 3-4 weeks.
Step 2: Analyze Patterns
Look for commonalities:
- Do most antecedents involve demands?
- Do most consequences involve adult attention?
- Are certain times of day over-represented?
Classroom Pulse auto-generates hypothesis suggestions based on your data patterns.
Step 3: Form Hypothesis About Function
Based on patterns, hypothesize: Is this escape, attention, tangible, or sensory?
Step 4: Design Intervention Targeting That Function
Choose strategies that address the identified function:
- Escape: Provide appropriate breaks, reduce task difficulty
- Attention: Scheduled attention, ignore minor behaviors
- Tangible: Token economy, teach requesting
- Sensory: Sensory alternatives, environmental modifications
Step 5: Measure Effectiveness
Continue data collection during intervention. Is frequency decreasing? This validates your function hypothesis.
Success Metrics That Matter
Newcomer et al. (2022):
84% of function-based interventions
showed 50%+ reduction within 4 weeks
The key? The function hypothesis must drive the intervention.
Ready to Move Beyond Frequency Data?
Start collecting ABC data that reveals WHY behaviors happen, not just WHAT. Classroom Pulse makes it fast, collaborative, and actionable.
Start 14-Day TrialFree for up to 3 students. No credit card required.
Next Steps & Resources
Key Takeaways
- ✅ ABC data is the gold standard because it identifies function, not just frequency
- ✅ Same behavior, different function = different intervention needed
- ✅ Modern digital tools remove the "too time-consuming" barrier
- ✅ 12-20 observations with proper ABC data reveals clear patterns
- ✅ Function-based interventions are 3x more effective than guesswork
What to Do Next
Download the ABC Data Cheat Sheet
Quick reference for common antecedents, consequences, and function hypotheses. Get it free
Try Classroom Pulse for ABC Data Collection
See how 30-second ABC logging and auto-pattern analysis transforms your FBA process. Start free trial
Read Next: The Data Collection Paradox
Discover why collecting MORE data isn't always better—and how to find your "Goldilocks zone" for maximum impact with minimum burden.
Research References
All research cited in this article:
- Geiger, K. B., Carr, J. E., & LeBlanc, L. A. (2021). Function-based treatments for escape-maintained problem behavior: A systematic review. Journal of Applied Behavior Analysis, 54(2), 485-508.
- Lambert, J. M., Bloom, S. E., & Irvin, J. (2022). Trial-based functional analysis and mand training: A systematic replication. Journal of Applied Behavior Analysis, 55(1), 3-18.
- Rooker, G. W., Iwata, B. A., Harper, J. M., Fahmie, T. A., & Camp, E. M. (2020). False-positive tangible outcomes in functional analyses: A methodological note. Journal of Applied Behavior Analysis, 53(1), 558-565.
- Rispoli, M., Ninci, J., Zaini, S., & Mason, R. (2021). A systematic review of noncontingent reinforcement for problem behavior. Journal of Applied Behavior Analysis, 54(3), 1230-1251.
- Rodriguez, N. M., Thompson, R. H., & Baynham, T. Y. (2023). Evaluating resurgence during differential reinforcement. Journal of Applied Behavior Analysis, 56(2), 311-327.
About the Author
The Classroom Pulse Team consists of former Special Education Teachers, BCBAs, and Educational Technology Specialists passionate about reducing teacher burnout through evidence-based, efficient behavior tracking solutions.
Have questions about implementing ABC data in your classroom? Contact us.
Take Action
Put what you've learned into practice with these resources.
Key Takeaways
- Frequency data alone tells you WHAT happened, but ABC data reveals WHY—enabling function-based interventions
- Antecedent = what happened before; Behavior = what the student did; Consequence = what happened after
- The same behavior can serve different functions—ABC patterns reveal whether it's escape, attention, sensory, or tangible
- Research shows function-based interventions are significantly more effective than those based on topography alone
- Consistent ABC documentation across 3-5 days typically reveals clear patterns for most behaviors
ABC Documentation Template
A ready-to-use ABC data collection form with common antecedents, behaviors, and consequences pre-filled, plus a function analysis guide.
ABC Data Mastery Quiz
Test your understanding of ABC data collection and function-based thinking.
Tags:
Ready to Transform Your Classroom?
See how Classroom Pulse can help you streamline behavior data collection and support student outcomes.
Start Tracking ABC Data TodayFree for up to 3 students • No credit card required
About the Author
The Classroom Pulse Team consists of former Special Education Teachers and BCBAs who are passionate about leveraging technology to reduce teacher burnout and improve student outcomes.
Related Articles
BIP Implementation Checklist: A Complete End-to-End Guide for Educators
Transform your Behavior Intervention Plans from documents into action. This comprehensive checklist guides you through every phase—from pre-implementation preparation to ongoing fidelity monitoring and data-driven adjustments.
The Four Functions of Behavior: A Complete Guide for Educators
Understanding WHY students behave the way they do is the foundation of effective intervention. Learn the four functions of behavior—attention, escape, tangible, and sensory—and how to identify them in your classroom.
How to Graph Behavior Data: A Visual Guide for Educators
Learn how to create clear, effective behavior data graphs for IEP meetings, progress monitoring, and data-driven decision making. Includes line graphs, bar charts, and trend analysis techniques.